今時は
TikZを使うべきなのかもしれないが,慣れているPStricksで作成。
readtataで読んで
dataplotで描くデータはOctaveで作ったが,何を使っても構わない。形式は,
(x1, y1) (x2, y2), ...。
documentclass{article}
usepackage{pstricks}
usepackage{pst-eps}
usepackage{pst-plot}
begin{document}
TeXtoEPS
psset{xunit=40mm, yunit=20mm}
pspicture(-2,0)(2,2.5)
readdata{mydata}{mountain.data}
dataplot[linewidth=2.0pt,plotstyle=curve]{mydata}
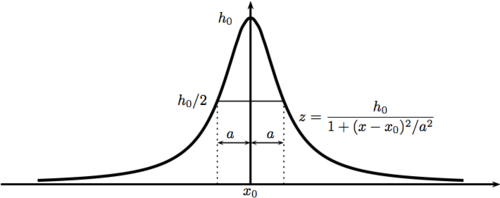
rput(-0.15,2){$h_0$}
rput(-0.35,1){$h_0/2$}
rput(-0.12,0.6){$a$}
rput(0.12,0.6){$a$}
rput(0.,-0.1){$x_0$}
rput(0.7,0.8){$displaystyle z=frac{h_0}{1+(x-x_mathrm{0})^2/a^2}$}
psaxes[linewidth=1.2pt,ticks=none,labels=none]{->}(0,0)(-1.5,0)(1.5,2.2)
psline(-0.2,1)(0.2,1)
psline{<->}(-0.2,0.5)(0.0,0.5)
psline{<->}(0.0,0.5)(0.2,0.5)
psline[linestyle=dotted](-0.2,0)(-0.2,1)
psline[linestyle=dotted](0.2,0)(0.2,1)
endpspicture
endTeXtoEPS
end{document}
0 件のコメント:
コメントを投稿